
Introduction
Welcome to my first AFL related post, thank you for visiting.
I hope to provide high quality analytical articles, challenge conventional wisdom, and promote discussion around stats outside of the box score. There will be articles that touch on topics that’s already been covered on similar blogs, where I have been inspired, or have found similar works, I will do my best to give credit and create a net of interesting articles I have found on the internet.
This will be my first series of articles, titled: AFL From Every Angle.
We will look at how the location of scoring shots (shots that resulted in either a goal or behind) has changed since the early 2000s. We will be looking at the angles, distances, teams, and accuracy from everywhere on the field. The series will start simple, and develop complexity, trying to understand the data from many angles.
There are many anecdotes and opinions about how the AFL has changed over the decades. This series will complement some of those opinions, and challenge others! Let’s get into it.
The data
3 separate sources were used to gather data across 2 decades, and each sources dataset was saved in a unique way. These sources and data types are shown below:
| Years Source | Scoring Shot Data Type | Visual |
|---|---|---|
| 2001-2014 (AFL) | Partitioned by ‘zones’ | 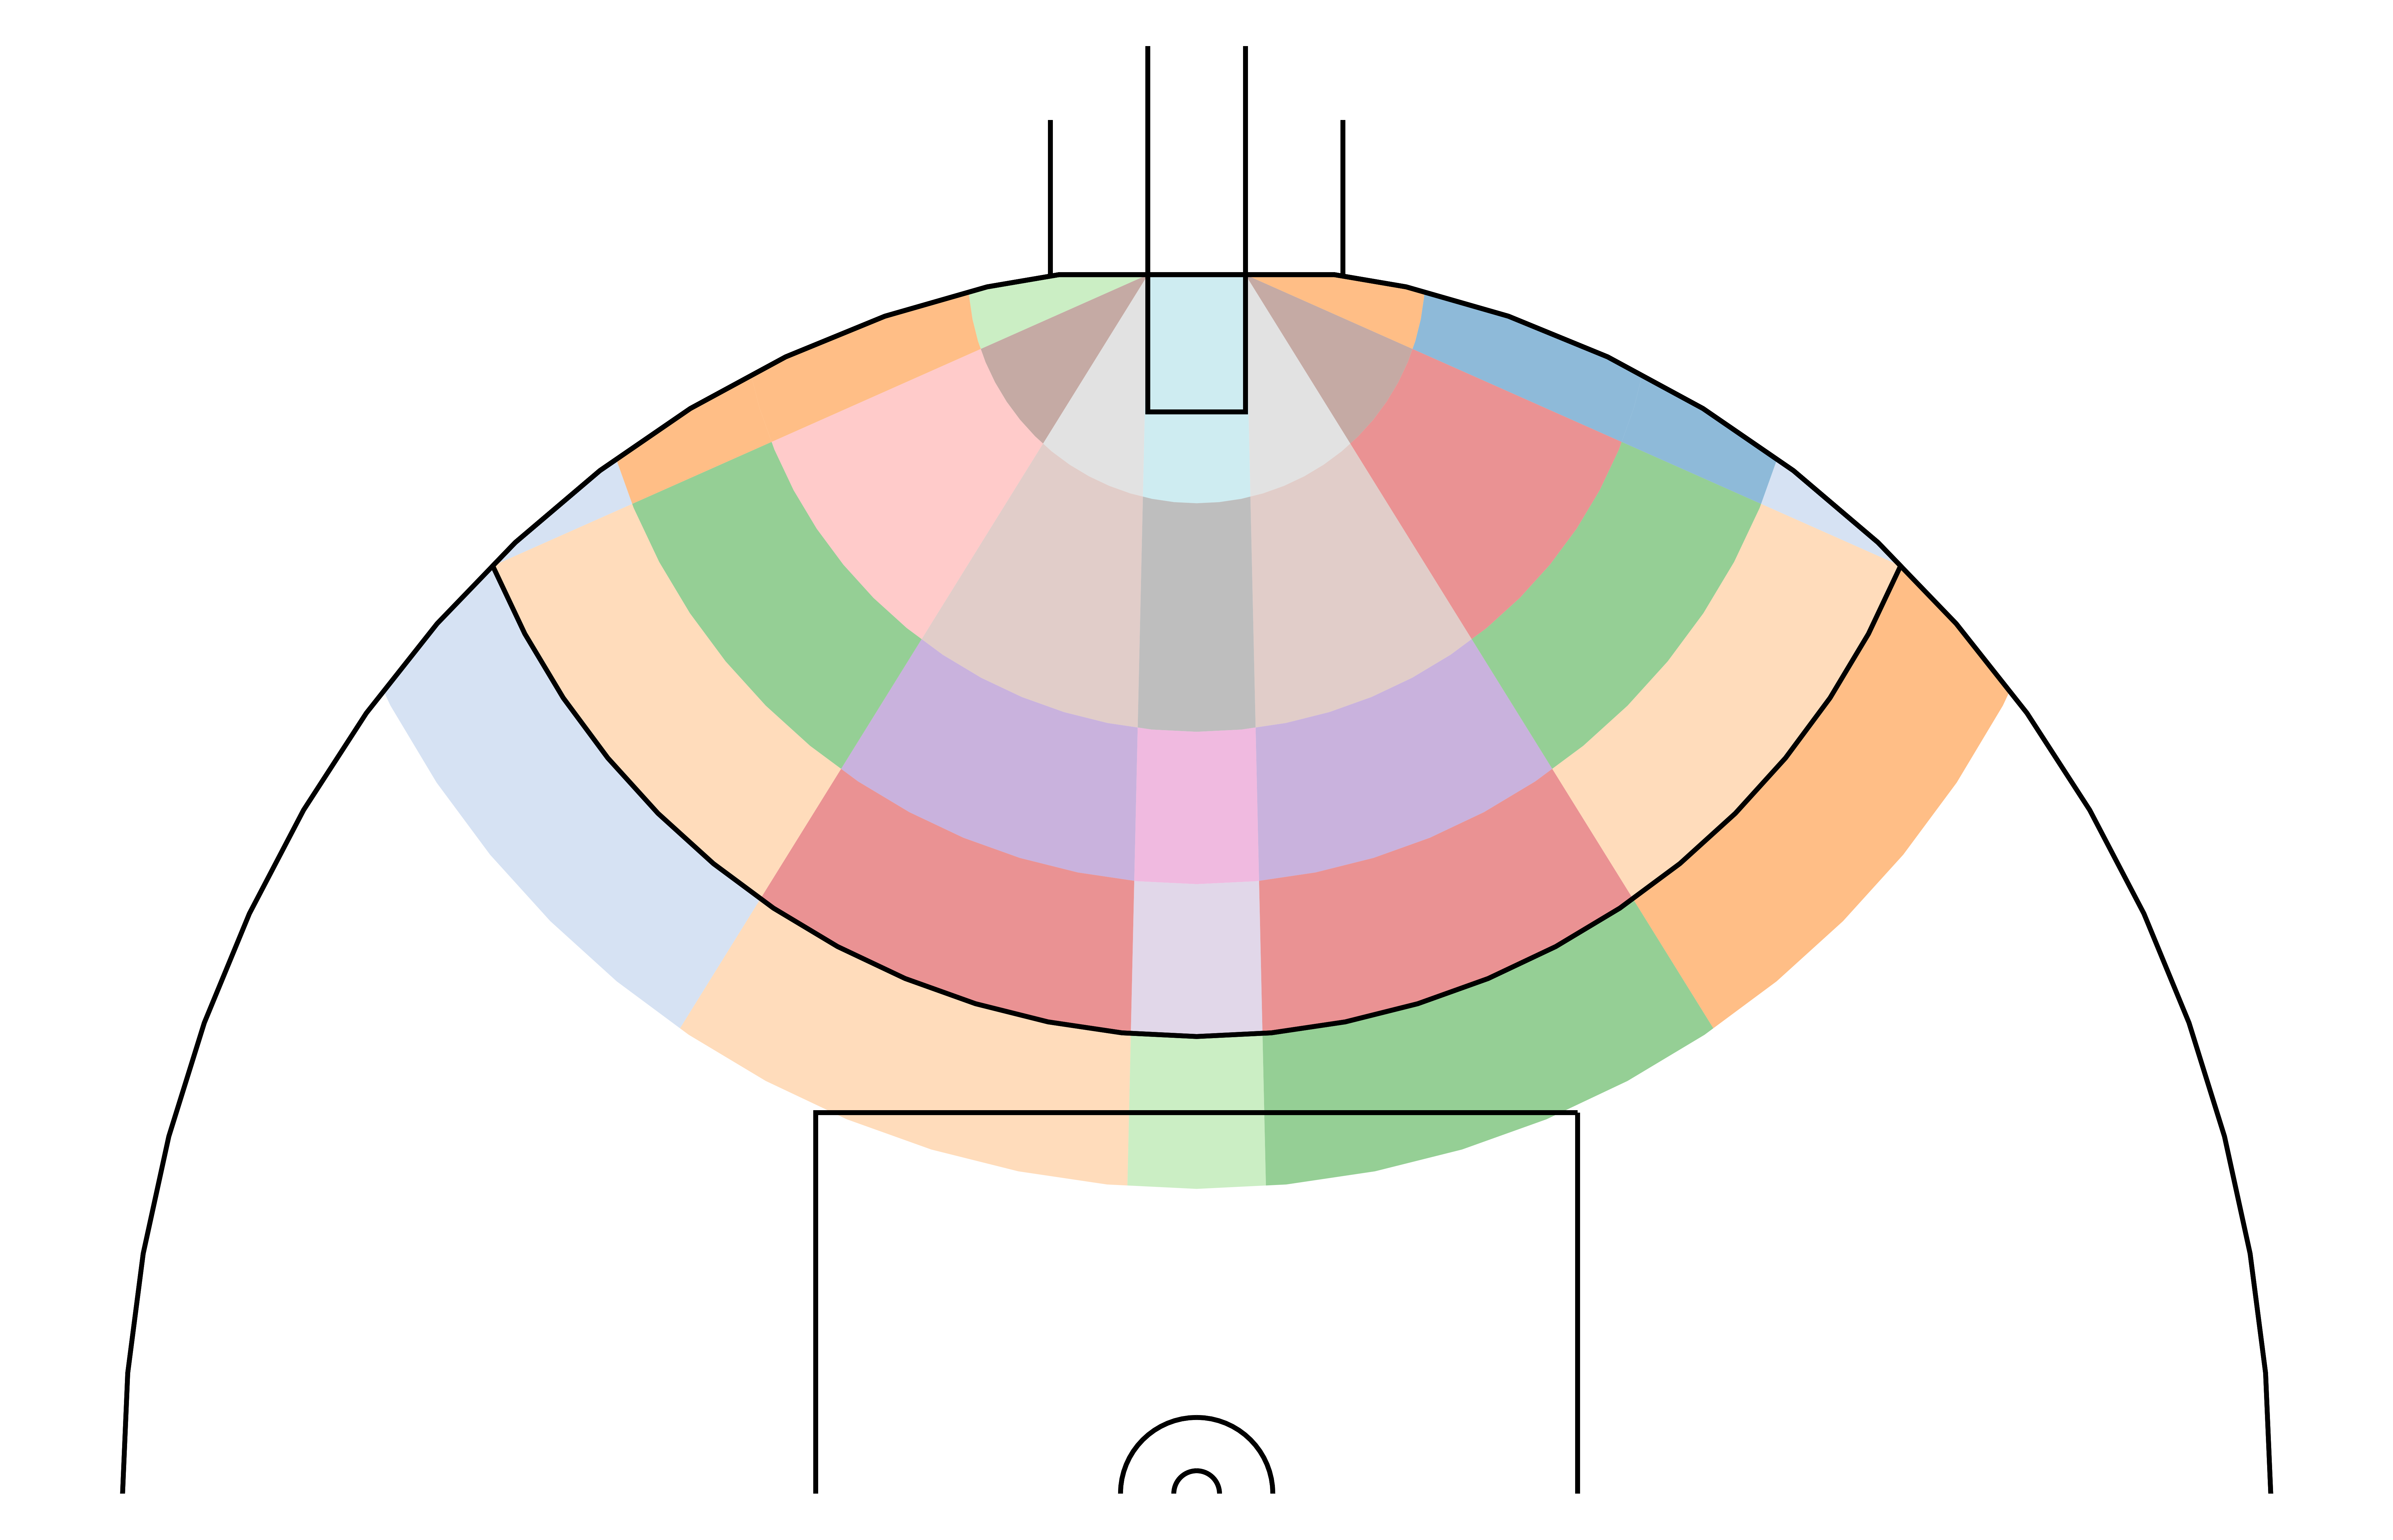 |
| 2015-2017 (None) | – | – |
| 2018-2020 (Stats Insider) | X and Y coordinates (5° and 5 metre increments) |  |
| 2021-Current (AFL) | X and Y coordinates |  |
The challenge from these disparate datasets is bringing them to a common basis, to compare shots on goal over time. Because of the low resolution of data between 2001-2014, where the shots were bucketed in zones rather than X and Y co-ordinates, this forces us to look at these trends on this zone basis.
Furthermore, only shots that resulted in a goal or behind (not rushed behinds) are recorded in the 2001-2014 dataset, so the other datasets are also put under this constraint. This means that shots that went out on the full or didn’t make the distance are excluded.
Let’s understand these zones. Simply, they are split into 2 partitions, angle and distance. These partitions are used in unison to define little pockets on the field. This is shown in the figure below, the angle diagram is the one that looks like a propellor hat, and the distance diagram a gobstopper.
A quick piece of information about these zones: the use of 30° is to specify that the angle is greater than 30° to the right or left of the closest goal post – this is how the AFL had defined these zones, I can’t alter this.

Data considerations
GPS tracking was introduced in 2005. Therefore, some of the years between 2001-2014 were likely visually assigned a zone rather than precise X and Y coordinates. Because of this, some stylistic choices and assumptions need to be made when classifying data from 2018 onwards – specifically, around the classification of shots taken on the boundary.
AFL grounds have different dimensions, with the boundary line on some of the fields at a sharper angle to goal than others. The issue of how a true observer would assign a zone needed to be considered. This was solved by determining the boundary angle for each field used in the competition, and each shots zone assessed based on which field the shot occurred on (which may have been overkill in hindsight but is an easy thing to undo in the future if this method introduced an error).
There were two issues with the Stats Insider data that needed to be addressed:
- Because the data was recorded in 5 metre increments, shots taken on the cusp of 2 distance ranges needed to be assigned one or the other. This could lead to overstating one of the groups, and understating the other. For all shots less than 50 metre that exist on a cusp, I have assumed it lies in the greater range of the two. But for shots assigned as 50 metre, this was not a correct assumption as the results produced did not align with the global trends (shown later in the piece). To combat this, I applied a 60% chance that it was within the 50 metre line, resulting in data that was consistent with the global trends.
- In general, Stats Insider was generous with the angle the shot was taken from as using the raw data produces an explosion of shots taken from the boundary in 2018-2020 (you can see this in Table 1 when comparing the sources, the Stats Insider example is the raw data). I have resolved this issue by applying an 90% factor on the assigned angle by Stats Insider so that the data aligns with the global trends. Although this assumption may not be perfect, judging by the results produced when not applying this factor, it is closer to correct than using the raw data.
Results
These following plots are normalised by year to show the percentage of shots that were taken in each partition, distance and angle. First we will look at each of the partitions separately – this gives us a general idea of trends without getting to in-depth.
We will also be looking at the data as normalised. This gives us a percentage of the total scoring shots that were taken from each partition specified. This is preferred as it removes the affect of low scoring years and games.
Kicking long for goal has slowly died

I love this trend, and how it speaks to general knowledge about the game from almost all commentators. Kicking long for goal has slowly died. Back in 2001, close to 50% of shots were taken from 40+ metre out. Now, for the first 9 rounds of 2023, it only accounts for 31%.
Teams are placing a higher value on kicks closer to the goal. Simply, it’s easier to kick a goal from 30 metre out than 50 metre – and this is causing the league to change the way they set up their forwards
There’s more variety in angle used to score

The distribution of angles utilised has dramatically changed over the last 5 years. That’s to say the variety of angles used to score has increased.
This change looks to have occured over the years where I have no data collected. And over a period where a change in data source was used to represent the trends.
Interestingly, the years before 2014, it looked as if the league was heading towards some sort of limit, or predictability. Clearly, something has changed to stop this trend of L and R kicks dominating the shots on goal.
This increase is likely due to…
Is the recent change in spread of angle a defense or attack preference?
Defending teams may have placed a high value in protecting the angles closer to directly in front of goal – namely, L and R. This will put tactics towards protecting these areas more than they have in years prior to 2014, giving forwards more space closer to the boundary. This is something defenders will naturally try to force their opponents to do so I don’t think this is anything that’s drastically changed to cause this. So are defenders getting better at protecting this space? Are teams setting up tactics, more midfield orientated, that reduce shots from here? Or are forwards less commanding to get shots from these areas?
The most likely scenario, and the argument that I subscribe to is that the distance and angle trends that we are looking at complement each other. The league has placed a higher value on getting the ball deep inside the forward 50 than taking a shot at a favorable angle. This preference of getting the ball in deep, means that it’s easier for defenders to push their opponents onto a sharper angle (when you move closer to the goal, moving 1 metre left or right has a greater impact on the angle that you take the shot from when compared to further out from goal).
There is a lot more behind the argument than what can be described by looking at shot taking. We would really need to understand what is happening multiple disposals leading to the shot. This is where AFL data can get really complicated, and really interesting. I am looking forward to understanding this more in articles outside of this series.
The right side is the preferred angle to shoot from
More shots come from the right side of the field than the left (when looking towards goal). Interestingly, this persists throughout the last 20 years with the only exception being in 2013 for the L/R zones, where more shots occurred in the L zone compared to R.
It’s most likely that the league has a bias to the right side of the field when moving the ball down the ground (this will be a story to tell for another time). A potential answer for this, is as simple as right foot dominance in the league.
What makes this observation more interesting is that in general, the league is less accurate from the right side than the left (this is a peek into what the next article will cover). So if attackers are deciding this preference, they are making the wrong choice from an accuracy perspective, unless taking the ball down the right side of the ground is easier – in which case, an opportunity cost exists between the two: the ease of getting the ball here, outweighs the decrease in accuracy.
Every shot, everywhere, all at once
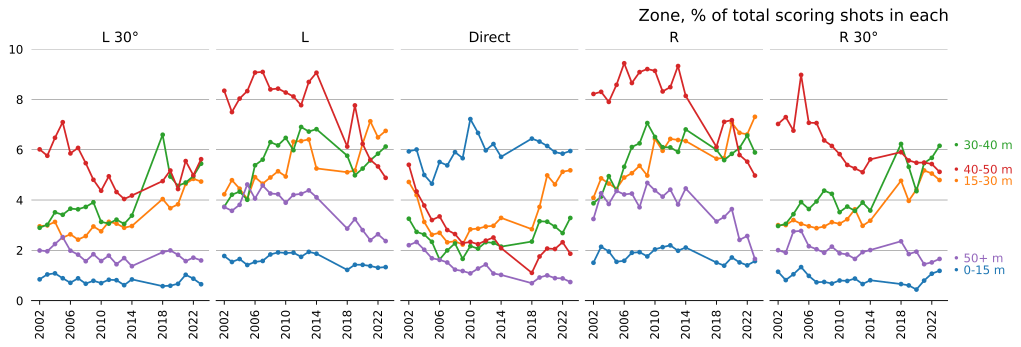
Finally, I want to share the percentage of shots from every zone on the field. This is similar to the featured image of this post, but put across a timeline since 2002. This is the highest resolution of how the percentage of scoring shots has changed over time. I don’t want to add commentary to add around this, the real value is just looking at it and comparing the results yourself. The main take-aways from this article have been touched on in the more general trends, and they hold true when the above diagram is used to complement the data.
I have omitted shots from boundary for logistical reasons that the image is a bit harder to consume, and being that these shots account for less than 5% of the total, we aren’t missing out on much.
Summary
- Shots from 40+ m out have steadily decreased from greater than 50 % of shots in 2002, to just over 30 % in 2002.
- A wider spread of angles to shoot for goal is being used now than in the past. This seems to be because teams are placing a higher value on shots that are closer to goal, rather than at an easier angle. Furthermore, by getting the ball closer to goal, it is easier for defenders to push their opponents to a harsher angle compared to a greater distance from goal.
- More shots come from the right side of the field than the left. This has held true for 20+ years, and is the case for each complementary angle zone. This is despite the league being slightly more accurate from the left side (to be seen in the next article).

Leave a comment